
Predicting Patient Length of Stay in Emergency Observation Units
LOSpatientsemergency.html
Conclusions and Final Considerations
The development of a machine learning-based system to estimate Tiempo en Observación in emergency units has proven invaluable for resource management across 55 IPS in Medellín. Through comparing four ML models (CatBoost, XGBoost, LightGBM, and a Neural Network with embeddings), CatBoost consistently offered the highest accuracy, with an average MAE of ~8.875 hours on validation data. This system was integrated into a web tool, enabling administrative staff to input patient data and quickly receive predictions accompanied by interpretative statistics (via SHAP).
Reducing certain features (Sexo, ZonaResidencia, NombreMunicipio, etc.) only marginally affected the MAE (+0.088 hours), thus improving efficiency and user experience. Future expansions include integrating this predictive system within a comprehensive Hospital Management System (HMS), allowing for real-time data flow and routine re-training to address model drift as hospital conditions evolve. Representativeness remains a limitation, as data was sourced from 55 IPS in Medellín. Nevertheless, the approach presents a robust prototype that can be extended to additional institutions and variables.
Database
The dataset (1,291,374 records) specifically captures patients who stayed in continuous-observation emergency wards. Variables included demographic data (edad, sexo), administrative details, and clinical diagnoses. For full details, refer to Registro Prestación Servicios Médicos en Urgencia.
Methodology
Machine Learning Development Stages
Following Nascimento et al. (2019), the project applied a four-stage framework for ML development:
- Problem Understanding: Clearly define the LOS prediction target, ensuring alignment with institutional goals.
- Data Handling: Acquire, structure, and preprocess the 1,291,374 records from 55 IPS to ensure data quality.
- Model Construction: Train and evaluate multiple models (CatBoost, XGBoost, LightGBM, neural nets) via MAE metrics and cross-validation.
- Model Monitoring: Once deployed, monitor performance and re-train as hospital or patient dynamics shift.
Exploratory Data Analysis
The EDA (based on Ghosh et al., 2018) included univariate, bivariate, and multivariate analyses. A major focus was identifying outliers (e.g., unrealistic ages) and merging coded variables with descriptive mappings. The dataset was highly skewed, with LOS ranging from 1 minute to ~664 days.
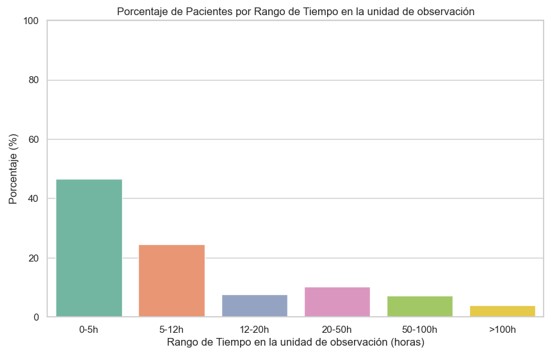
Figure 1 below (placeholder) illustrates the distribution of TiempoenObservación. Over 50% of patients remain fewer than 5 hours, yet ~19.36% exceed 24 hours.
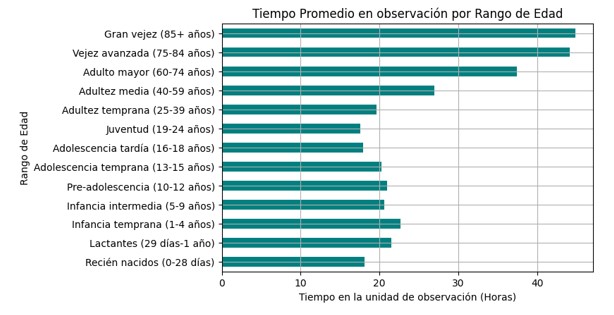
Age-based Analysis: As seen in Figura 2 (placeholder), older adults (85+ years) exhibit a notably longer mean stay. Chronic respiratory diseases, cardiac conditions, and urinary tract infections are most frequent in this age group.
External Causes & Gender: Accident-related issues (more prevalent in younger males), while suspicion of abuse or sexual violence predominantly affected younger females.
IPS Dynamics: Certain IPS specialized in mental health (e.g., METROSALUD - Unidad de Salud Mental) had average stays beyond 400 hours. Private clinics (e.g., Clínica Las Américas) displayed high occupancy (~177 patients) and lengthy LOS (~236 hours).
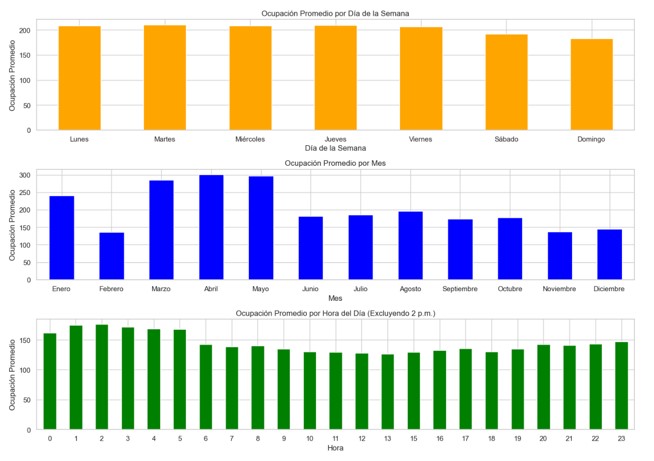
Distribution of Occupancy by Day, Month, and Hour: As shown in Figura 3 (placeholder), differences by weekday are minimal, though weekends slightly decrease. March and April present higher average occupancy, possibly tied to increased respiratory conditions. A notable peak at 2:00 p.m. (~700 patients) arises from administrative batch entries (e.g., Virrey Solís IPS).
Feature Engineering
We unified age measurements (months/days) to years, removing rows beyond 110 years. Categorical columns were recast to strings, discarding invalid municipality data and “I” in Sexo. A lower limit of 30 minutes was enforced for LOS, removing ~4.86% of unrealistic short stays.
A crucial addition was HospitalOccupancy, aggregating daily bed usage by hospital. Non-essential columns (e.g., raw “Codigo” columns, timestamps) were dropped after computing LOS.
Results and Variable Impact
Training XGBoost, LightGBM, CatBoost, and a neural net with embeddings showcased CatBoost as the top performer (MAE ~8.875 hours). Categorical features were efficiently handled without one-hot encoding.
SHAP Analysis: Key contributors included NombrePrestadorSede (+8 hours) and HospitalOccupancy (~+6 hours). Meanwhile, Sexo, ZonaResidencia, or specific diagnosis columns had minimal effect (minus 0.5 hours). Removing them only raised MAE by +5 min, improving real-world usability.
Extended Exploratory Analysis
Occupancy Impact: Once HospitalOccupancy was created, we analyzed how daily bed usage affects LOS. Polynomials fitted to SHAP values revealed acceleration ~679 beds (private) vs. ~587 beds (public), then saturation at ~1,064 (private) and ~653 (public). Public IPS showed average stays of 37.28 hours vs. 19.98 hours in private, though private centers reached occupancy peaks of 1,832 patients.
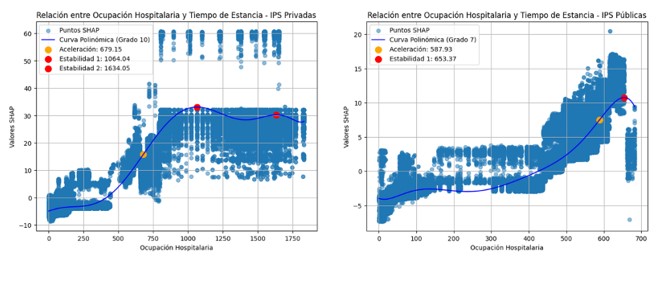
IPS Public vs Private: Occupancy analysis underscores the heavier burden in some public IPS, but private IPS can spike higher in peak times. This interplay highlights resource allocation challenges across the system.
Implementation
Flujo de la Página Web
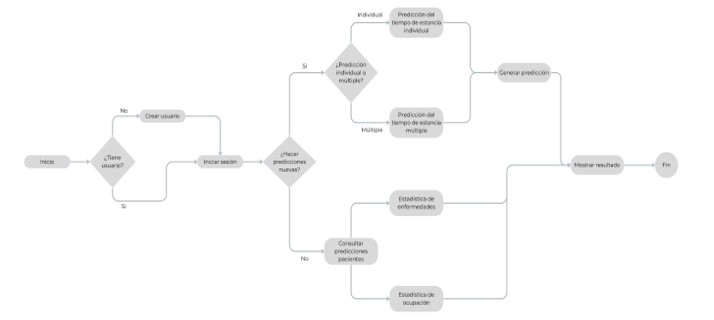
An interactive web page was developed for administrative staff and resource coordinators to manage and predict patient stay times:
- Predicción del Tiempo de Estancia (Individual): Users input patient data (diagnoses, occupancy, IPS) for an immediate LOS prediction. SHAP-based visuals show influential factors.
- Predicción del Tiempo de Estancia (Múltiple): Batch CSV uploads for multiple patients. Stats like mean, min, max, and top N extremes help optimize processes.
- Estadísticas Pacientes: Disease impact analysis (diagnostics by month, day, year, age group, sex, external cause) to plan resources and identify trends.
- Estadísticas de Ocupación: Graphs indicating acceleration and saturation points in hospital occupancy to guide bed/personal allocation.
Figura 5 (placeholder) diagrams the logical flow: after login, users navigate via a sidebar to these functionalities.
Modelado de datos
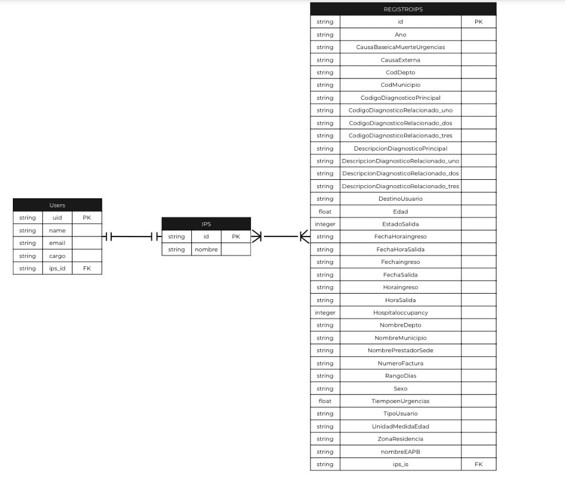
Figura 6 (placeholder) depicts an ER diagram with USERS, IPS, and REGISTROSIPS. Each user references an IPS; REGISTROSIPS holds patient details, ensuring traceability and scalable data organization.
Arquitectura del Sistema
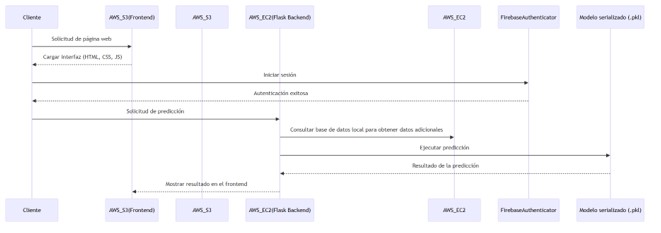
Hosted on AWS S3 (frontend) and AWS EC2 (Flask backend, databases). Users authenticate via Firebase, send requests to the EC2 server, which loads the CatBoost model. Data is fetched from local databases, then results and SHAP analyses are returned to the frontend.
Seguridad y Privacidad
- Autenticación de Usuarios: Firebase ensures only registered staff can access or modify relevant data.
- Cifrado y Almacenamiento Seguro: EC2 + S3 use encryption in transit/at rest; strict IAM roles limit inbound/outbound connections.
- Control de Credenciales: Sensitive keys remain environment variables, never exposed in source code.
Post-Thesis Improvements
After the thesis presentation, several enhancements were made:
- Cognito instead of Firebase Authentication: Migration to Amazon Cognito improved security, offered passwordless login features, and seamlessly integrated with other AWS services.
- HTTPS Deployment via CloudFront: Instead of the S3 website endpoint (HTTP only), the site is now behind AWS CloudFront with an SSL certificate, ensuring secure connections.
- Further Architecture Refinements: Additional environment variables and IAM roles locked down resources, meeting HIPAA-like requirements for patient data. Monitoring with Amazon CloudWatch was also introduced for performance metrics.
These steps ensure a robust, scalable, and secure platform that can adapt to changing healthcare demands.
Thesis Grade Certification
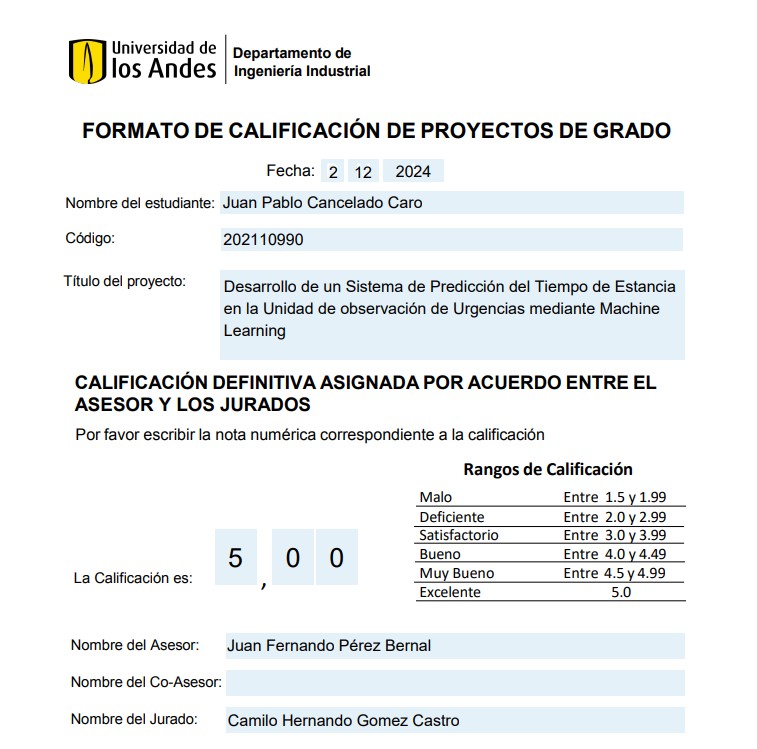
The final project was awarded a 5.0 (top score) in all evaluation criteria, confirming both technical rigor and practical impact.
References
ADRES (2022). Entidades SGSSS. Disponible en:
Link
Alcaldía de Medellín (2023). Registro Prestación Servicios Médicos en Urgencia con Observación. Disponible en:
Link
Nascimento et al. (2019). Understanding Development Process of Machine Learning Systems: Challenges and Solutions. ACM/IEEE Symposium on Empirical Software Engineering and Measurement.
Ghosh et al. (2018). A Comprehensive Review of Tools for Exploratory Analysis of Tabular Industrial Datasets. Visual Informatics.
Link
Prokhorenkova et al. (2019). CatBoost: Unbiased Boosting with Categorical Features. arXiv.
Link